Grafana Dashboards
Grafana reads the PostgreSQL storage database directly. Configure a PostgreSQL datasource that points at the same database used by the scraper.
:::tip Explore the dashboards Open the public Harry live demo to use the included dashboards with a running dataset before installing them. No account is required. :::
The Docker Compose test stack provisions the datasource automatically from:
docker-compose/grafana/datasources/datasources.yaml
Dashboard JSON files are stored in:
docker-compose/grafana/dashboards/
Included Dashboards
Oracle Alerting Overview
File:
docker-compose/grafana/dashboards/oracle-alerting-overview.json
Purpose:
- Current firing, pending, no-data, and error states from Grafana Alerting.
- Latest collector health across every configured Oracle database.
- Failed or stale collectors requiring investigation.
- Allocated and maximum tablespace pressure, finite resource-limit pressure, and ASM capacity risks.
- Latest database identity, product version, Data Guard protection, and instance state.
- Current database CPU demand and PGA pressure across the monitored fleet.
- Normal Oracle alert instances that confirm rule evaluation.
This is a global operations dashboard. It intentionally has no
source_database variable: alert responders must see problems from every
monitored database without selecting one first. Database values in PostgreSQL
tables link to the corresponding database in Oracle Operational Overview.
The Alert list panels query Grafana's actual alert-rule state and are authoritative for firing and pending status. PostgreSQL panels provide the current investigation context; they do not independently reproduce Grafana's pending durations, no-data handling, or silences. CPU and PGA pressure are informational dashboard signals until representative alert thresholds have been validated; Harry does not provision default alert rules for them.
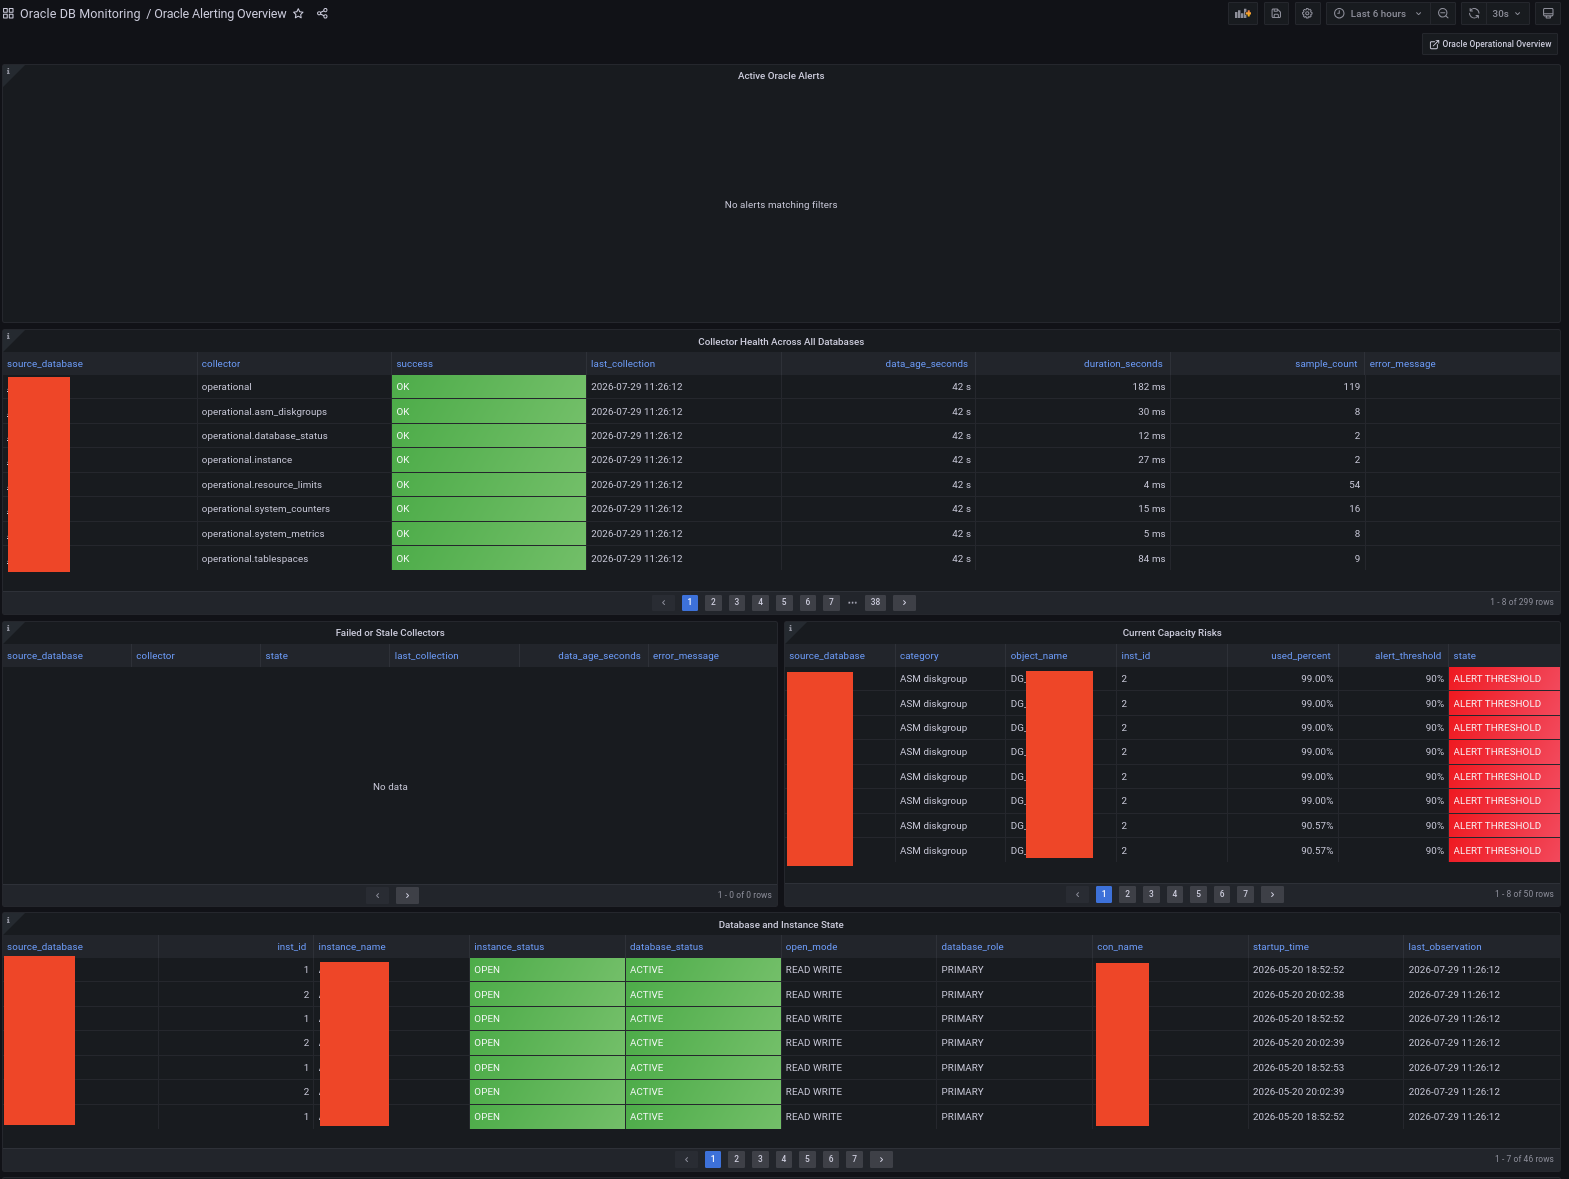
Oracle Alerting Overview dashboard with anonymized sample data. Select the image to open it at full resolution.
Oracle Operational Overview
File:
docker-compose/grafana/dashboards/oracle-operational-overview.json
Purpose:
- Collector success, freshness, duration, and errors.
- Per-database collector-duration trends and activity query timeout utilization.
- Stable database identity, Oracle product/version, database role, Data Guard protection, and instance state.
- Session and process utilization.
- Current SGA/PGA allocation and configured memory capacity.
- Tablespace used, allocated, and maximum capacity plus ASM capacity.
- Oracle resource-limit pressure.
- Reset-aware CPU and database-time demand, SQL and transaction rates, block activity, IOPS, I/O throughput, redo generation, and wait-class rates.
Primary tables:
oracle_database_status_samples
oracle_instance_samples
oracle_resource_limit_samples
oracle_tablespace_samples
oracle_asm_diskgroup_samples
oracle_system_counter_samples
oracle_wait_class_samples
oracle_scrape_status
oracle_latest_scrape_status
harry_latest_runtime_status
The dashboard uses native typed operational data. It does not query
oracle_metric_samples.
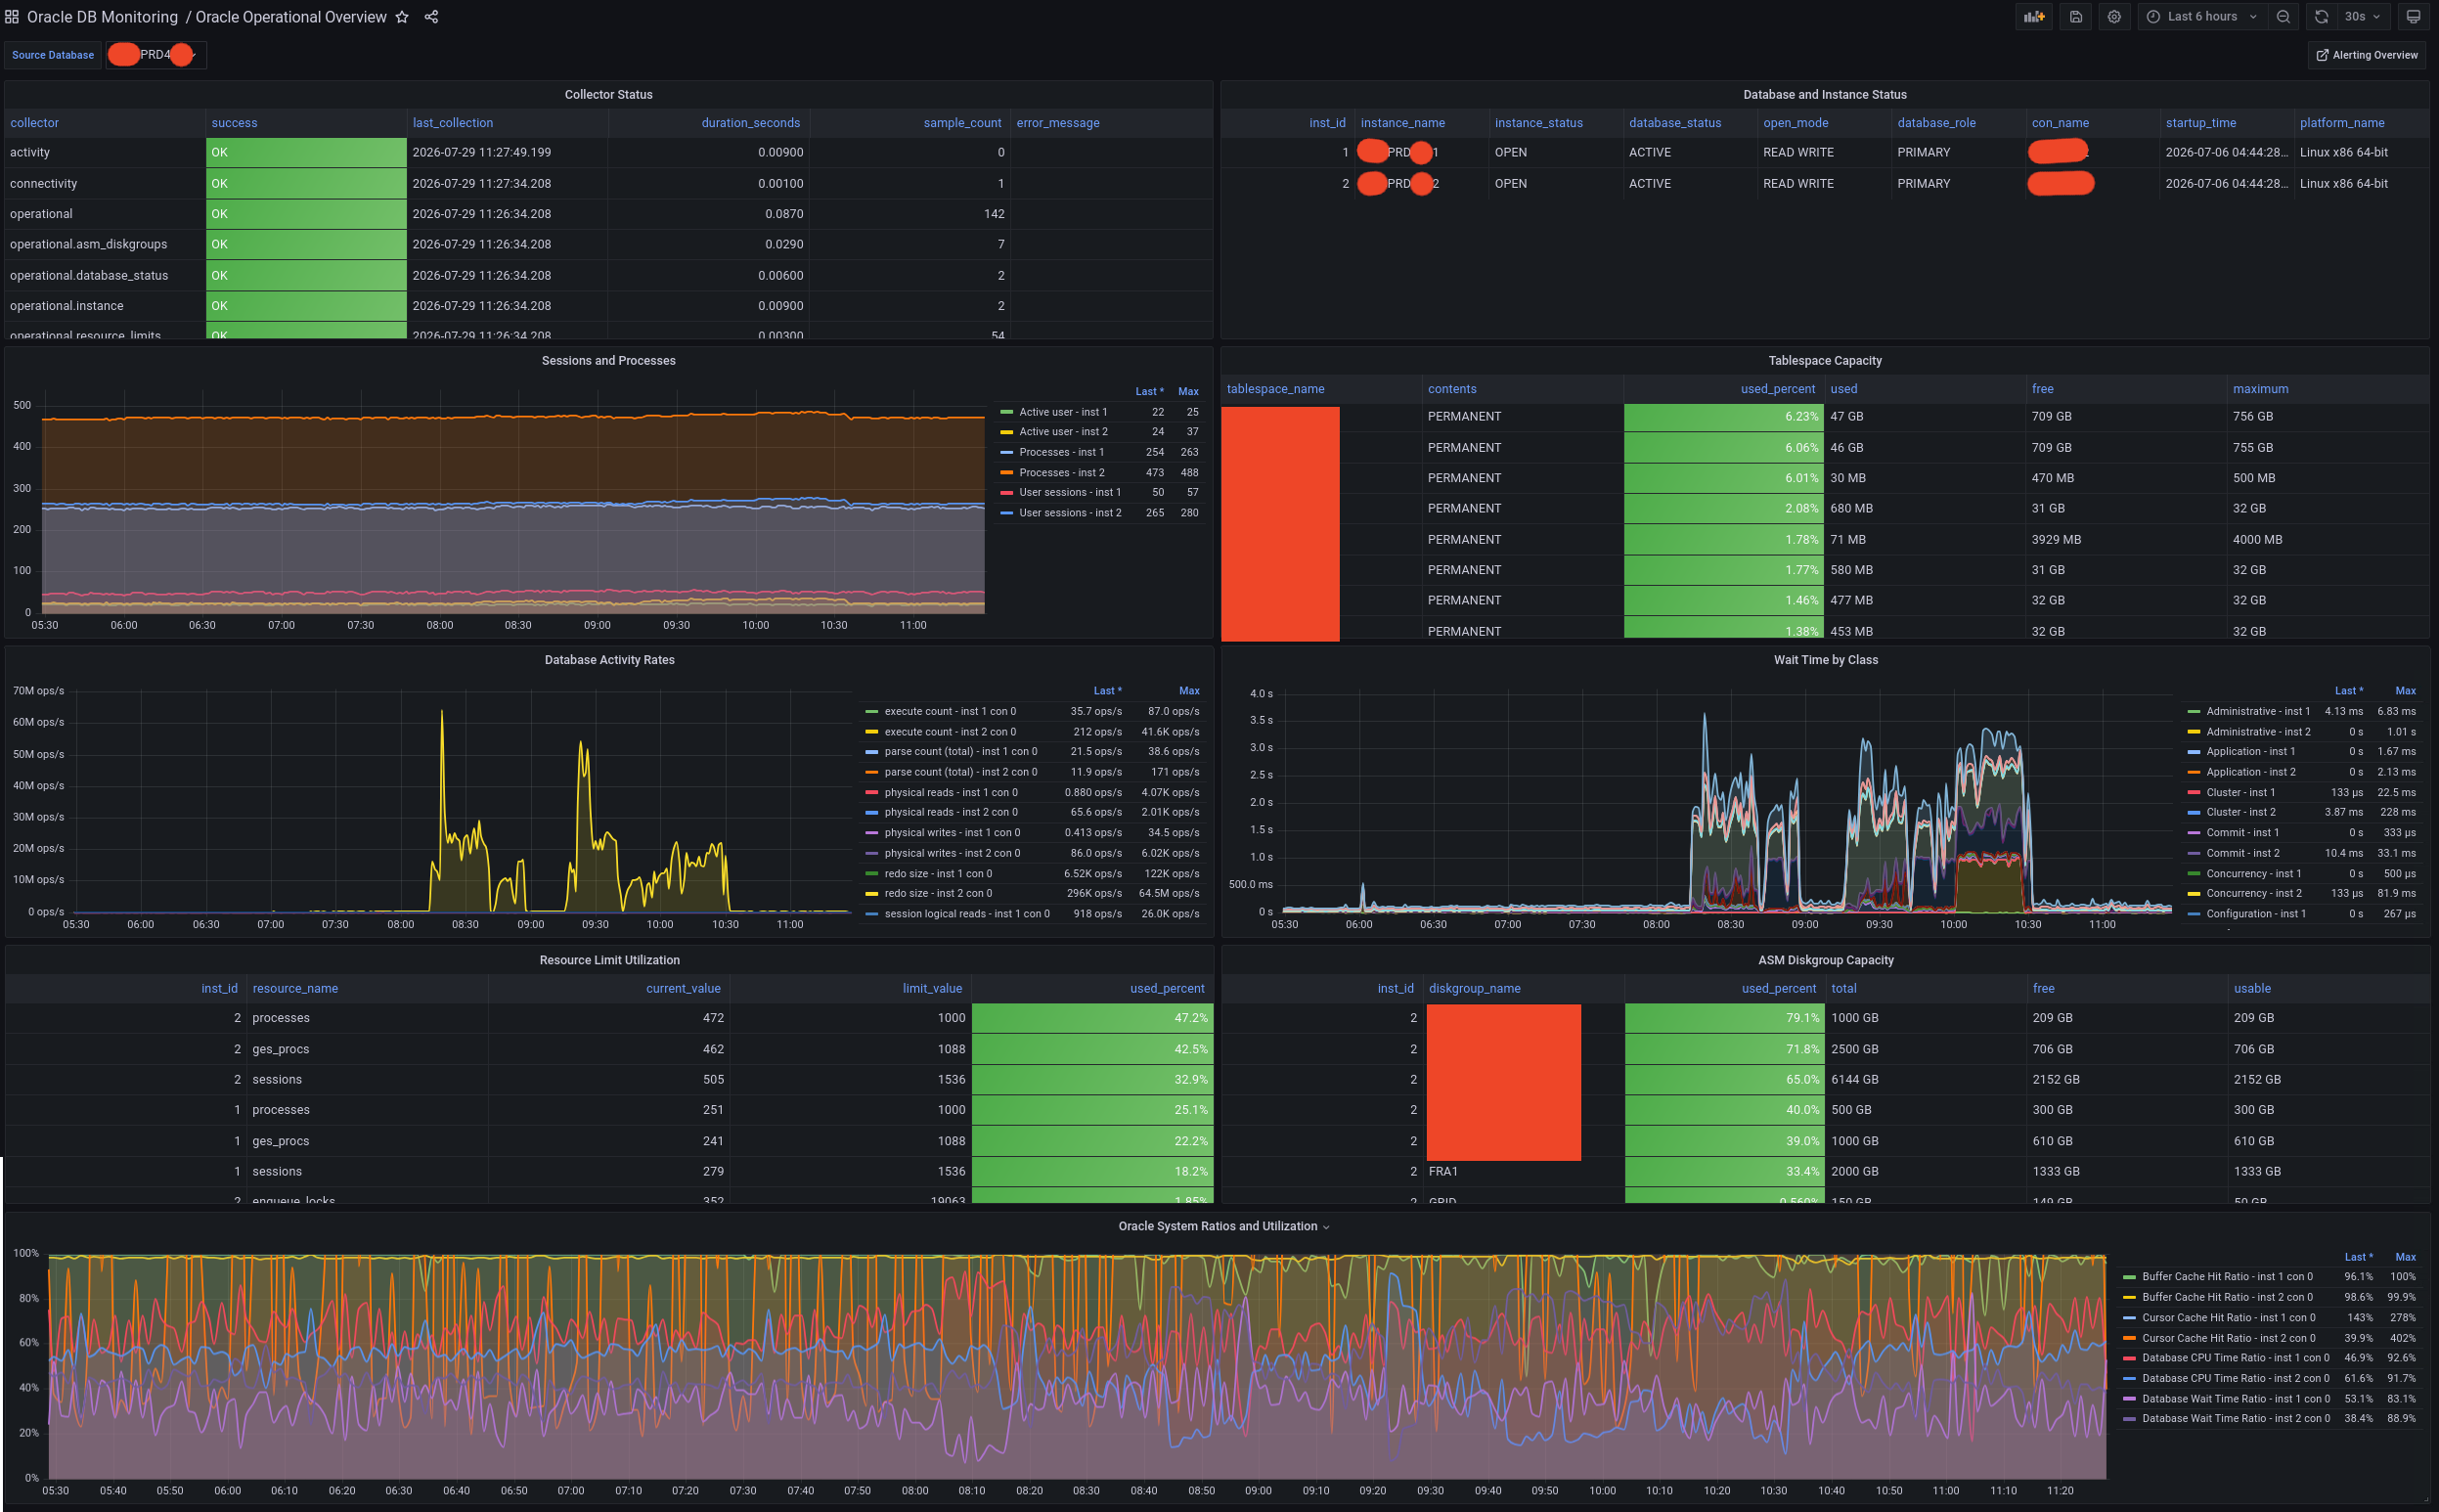
Oracle Operational Overview dashboard with anonymized sample data. Select the image to open it at full resolution.
Database Activity History (DAH)
File:
docker-compose/grafana/dashboards/database-activity-history.json
Purpose:
- Average active sessions by wait class.
- Database-level CPU-core and DB-time demand as a time-model reference.
- Top SQL by active samples.
- Top sessions by active samples.
- Activity by
SQL_ID. - Recent activity samples.
- Top wait events.
- Module/program activity.
Primary tables:
oracle_database_activity_samples
oracle_system_counter_samples
This dashboard is the AAS-style historical activity view. It intentionally uses high-cardinality fields that should not be Prometheus labels. The database time-model panel complements sampled activity but cannot attribute its CPU or DB-time values to individual SQL statements, sessions, or wait classes.
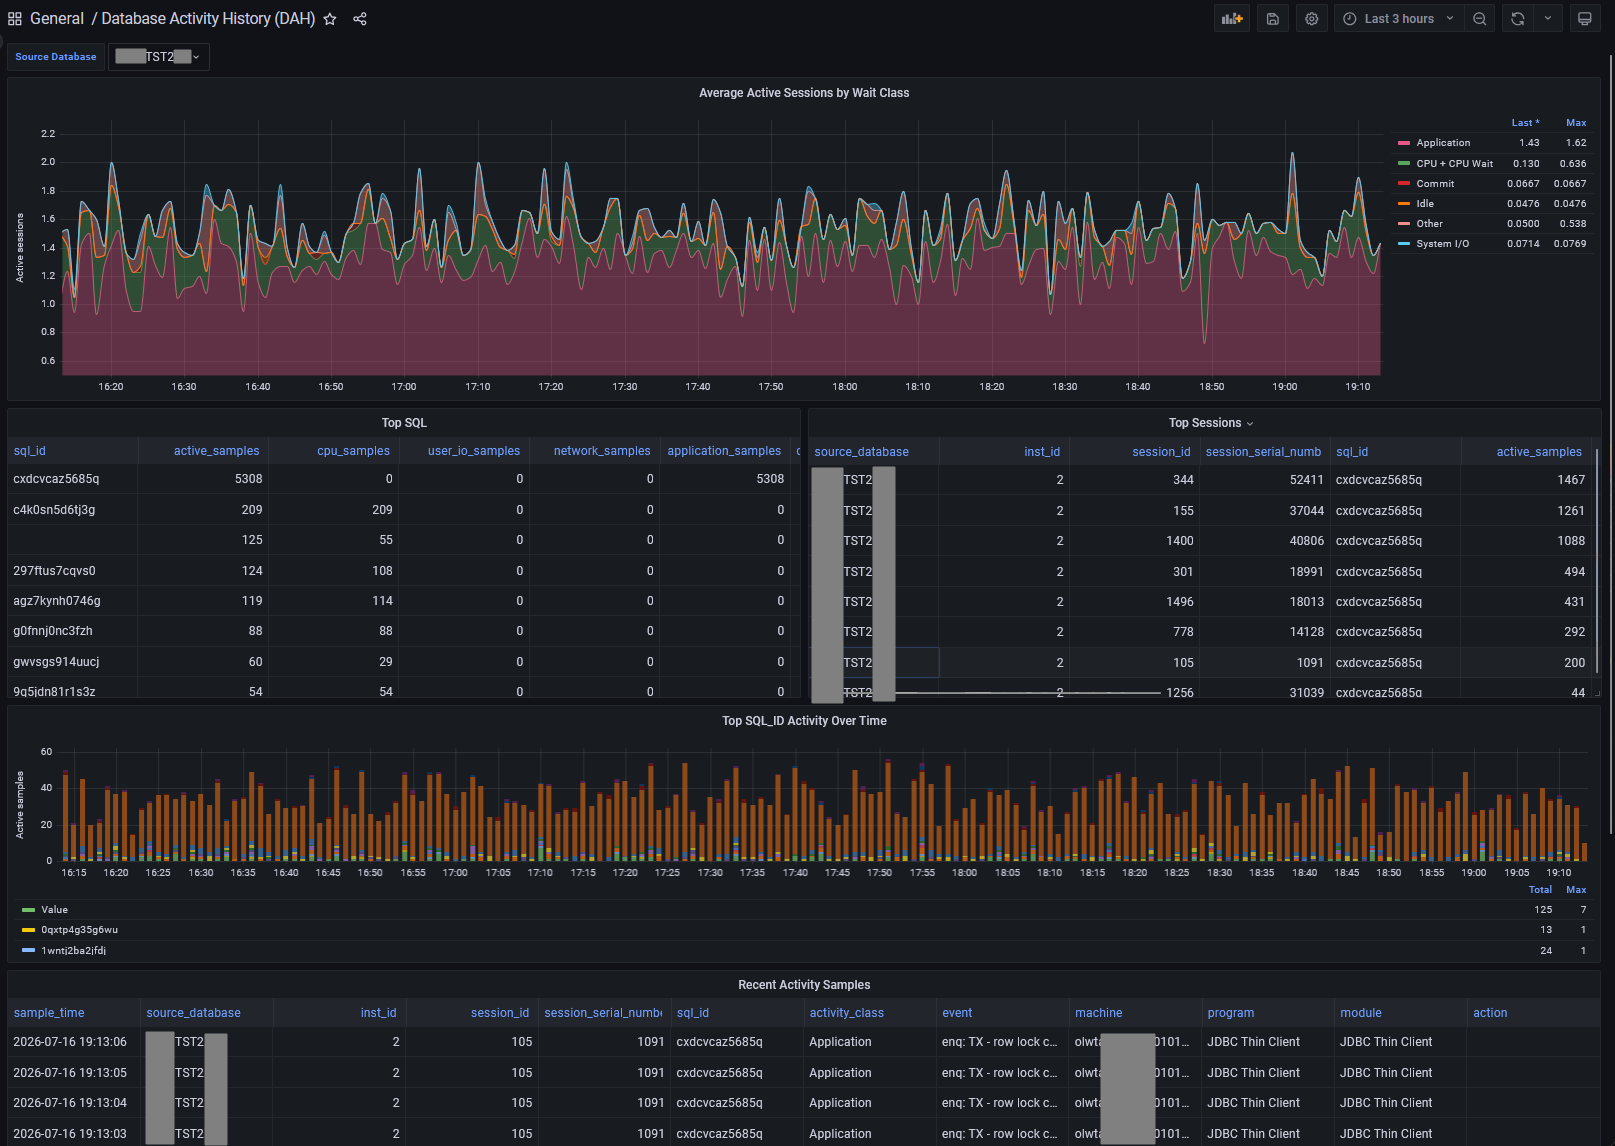
Database Activity History dashboard with anonymized sample data. Select the image to open it at full resolution.
The Activity Source variable keeps SESSION, ASH, and migrated LEGACY
rows separate. SESSION is the default collector. ASH appears only when the
scraper was explicitly configured to use Oracle ASH and the operator accepted
responsibility for verifying Diagnostics Pack licensing.
Oracle SQL Top Consumers
File:
docker-compose/grafana/dashboards/oracle-sql-top-consumers.json
Purpose:
- Top 20 SQL consumers for the selected time range, ranked by elapsed time, CPU time, User I/O wait, executions, buffer gets, disk reads, or elapsed time per execution.
- One-minute average database-time contribution for elapsed, CPU, User I/O, application, concurrency, and cluster time.
- One-minute average execution, row-processing, and parse-call rates.
- One-minute average buffer-get, disk-read, and direct-write rates.
- Category ranks, SQL efficiency indicators, and the dominant measured pressure for every top consumer.
- Available plan hashes, child cursors, parsing schemas, application modules, and cached execution-plan operations for the selected SQL ID.
- Complete
SQL_FULLTEXTfor the selectedSQL_ID.
The top table is the entry point for statement-level troubleshooting. Use
Rank SQL by to change which SQL statements enter the Top 20; this changes the
PostgreSQL ranking before the limit rather than sorting a fixed result set in
the browser. Elapsed Time is the default. Elapsed / Execution preserves the
efficiency-outlier workflow and is supported by rows processed, buffer gets per
row, and disk reads per execution columns.
Each SQL ID occupies one Top 20 position. Harry calculates counter deltas
independently for each Oracle instance and plan, then combines them by SQL ID
to rank the statement's total database impact. Select a SQL_ID to populate
the detailed graphs, full SQL text, and plans below it. Select
PLAN_HASH_VALUE when a statement has multiple collected plans. The Selected
SQL Plan Hashes table reads child-cursor, schema, and module context from
oracle_sql_cursor_metadata only after a SQL ID is selected. The plan panel
displays the cached GV$SQL_PLAN operation tree, objects, optimizer estimates,
partition bounds, and predicates; it does not contain runtime ALLSTATS
values.
Plan-operation colors identify access and join methods for visual scanning; they do not classify an operation as universally good or bad. Full application table scans and Cartesian joins are red, index access is green, hash joins are yellow, nested loops are blue, merge joins are orange, and sorts are purple. Oracle fixed-table scans are not treated as application-table full scans.
The review_signal column highlights an initial investigation point:
CARTESIAN: the operation or options containCARTESIAN.FULL SCAN: aTABLE ACCESSoperation has aFULLoption.TEMP: the optimizer estimates non-zero temporary space.HIGH ESTIMATE: estimated cardinality is at least 100,000 rows, estimated bytes are at least 100 MiB, or optimizer cost is at least 10,000.
These are heuristics. Object size, selectivity, actual row counts, and workload frequency still determine whether an operation is a performance problem.
The top table totals counter deltas over the selected dashboard range. Detail graphs first divide each delta by the actual interval between PostgreSQL samples, then average those rates into one-minute buckets. This avoids a misleading sawtooth when a cumulative Oracle counter changes less frequently than the scraper interval. A zero remains meaningful: no corresponding work completed during that observation interval.
SQL text and plan details are collected on the bounded performance.sqlPlans
schedule. A top consumer can therefore appear before its detail is collected,
or after its Oracle cursor has aged out. The dashboard reports that state as
Not collected or aged out instead of hiding the SQL statistics.
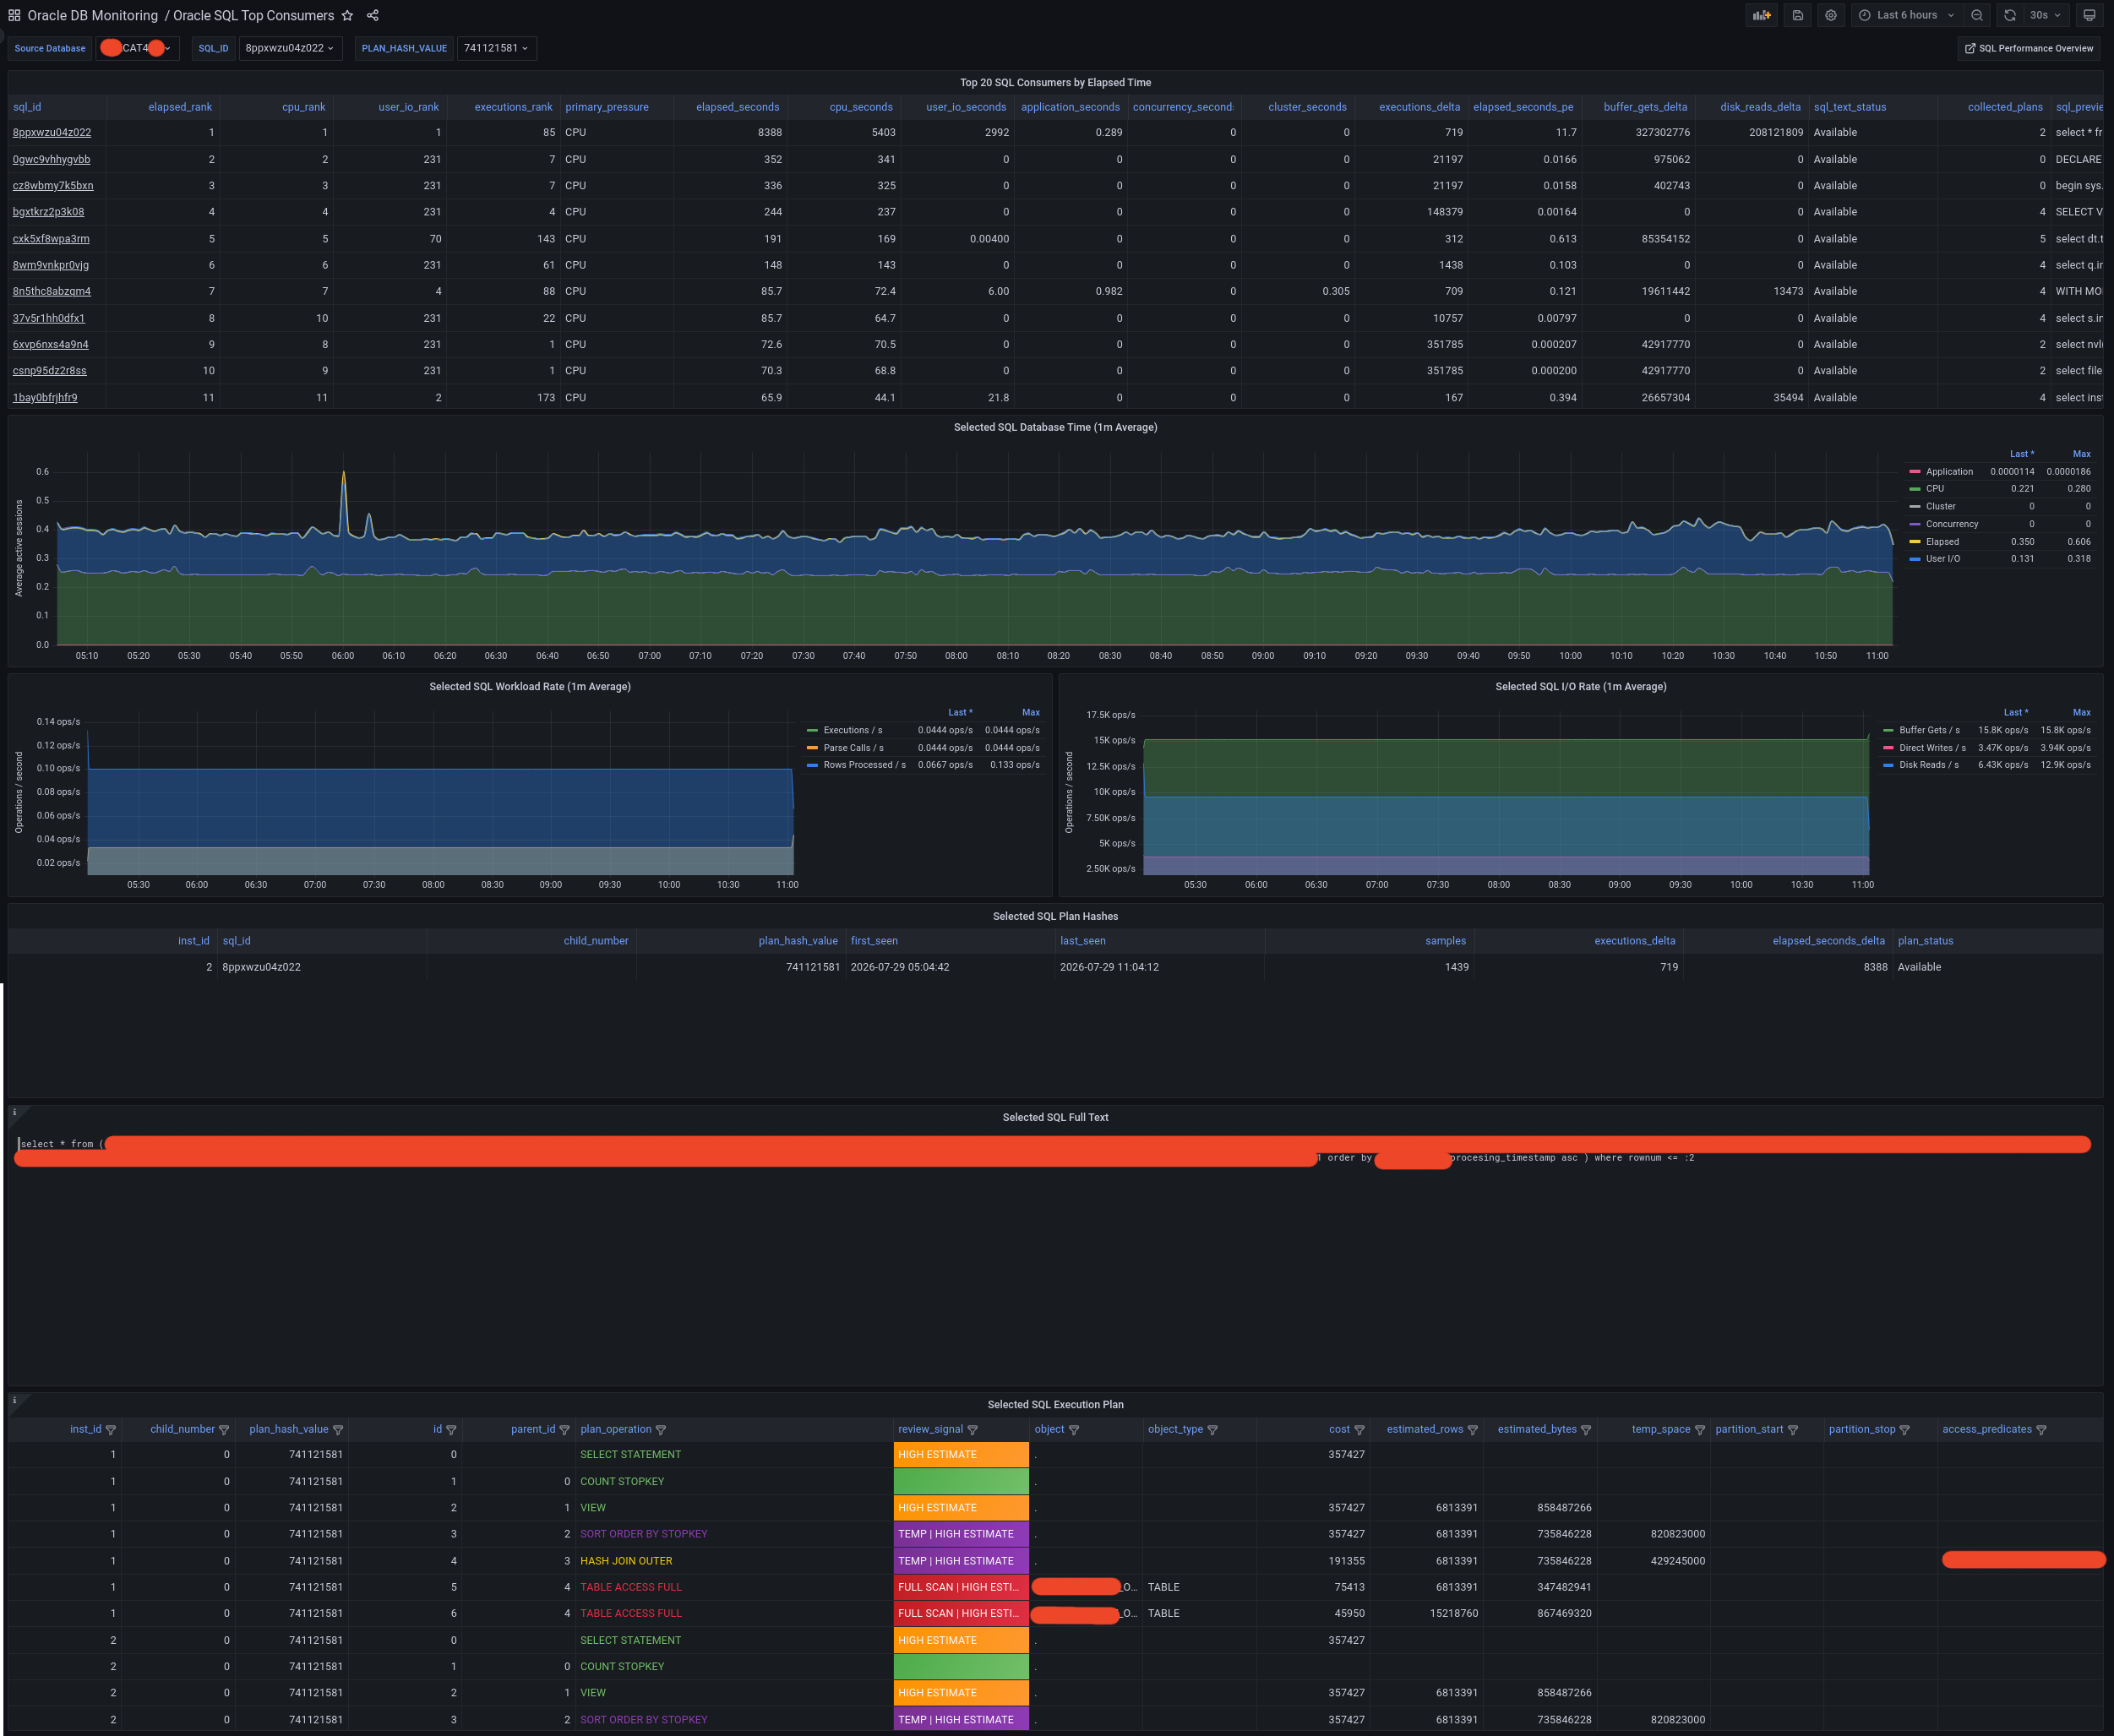
Oracle SQL Top Consumers dashboard with anonymized sample data. Select the image to open it at full resolution.
Current Sessions and Blocking
File:
docker-compose/grafana/dashboards/oracle-sessions-and-blocking.json
Purpose:
- Current active SQL sessions.
- Current waiters by event.
- Long-running active sessions.
- Blocking sessions.
- Session inventory by user, module, and program.
Primary tables:
oracle_session_samples
oracle_blocking_session_samples
This dashboard is the current-state triage view. Historical active-session graphs live in the DAH dashboard instead.
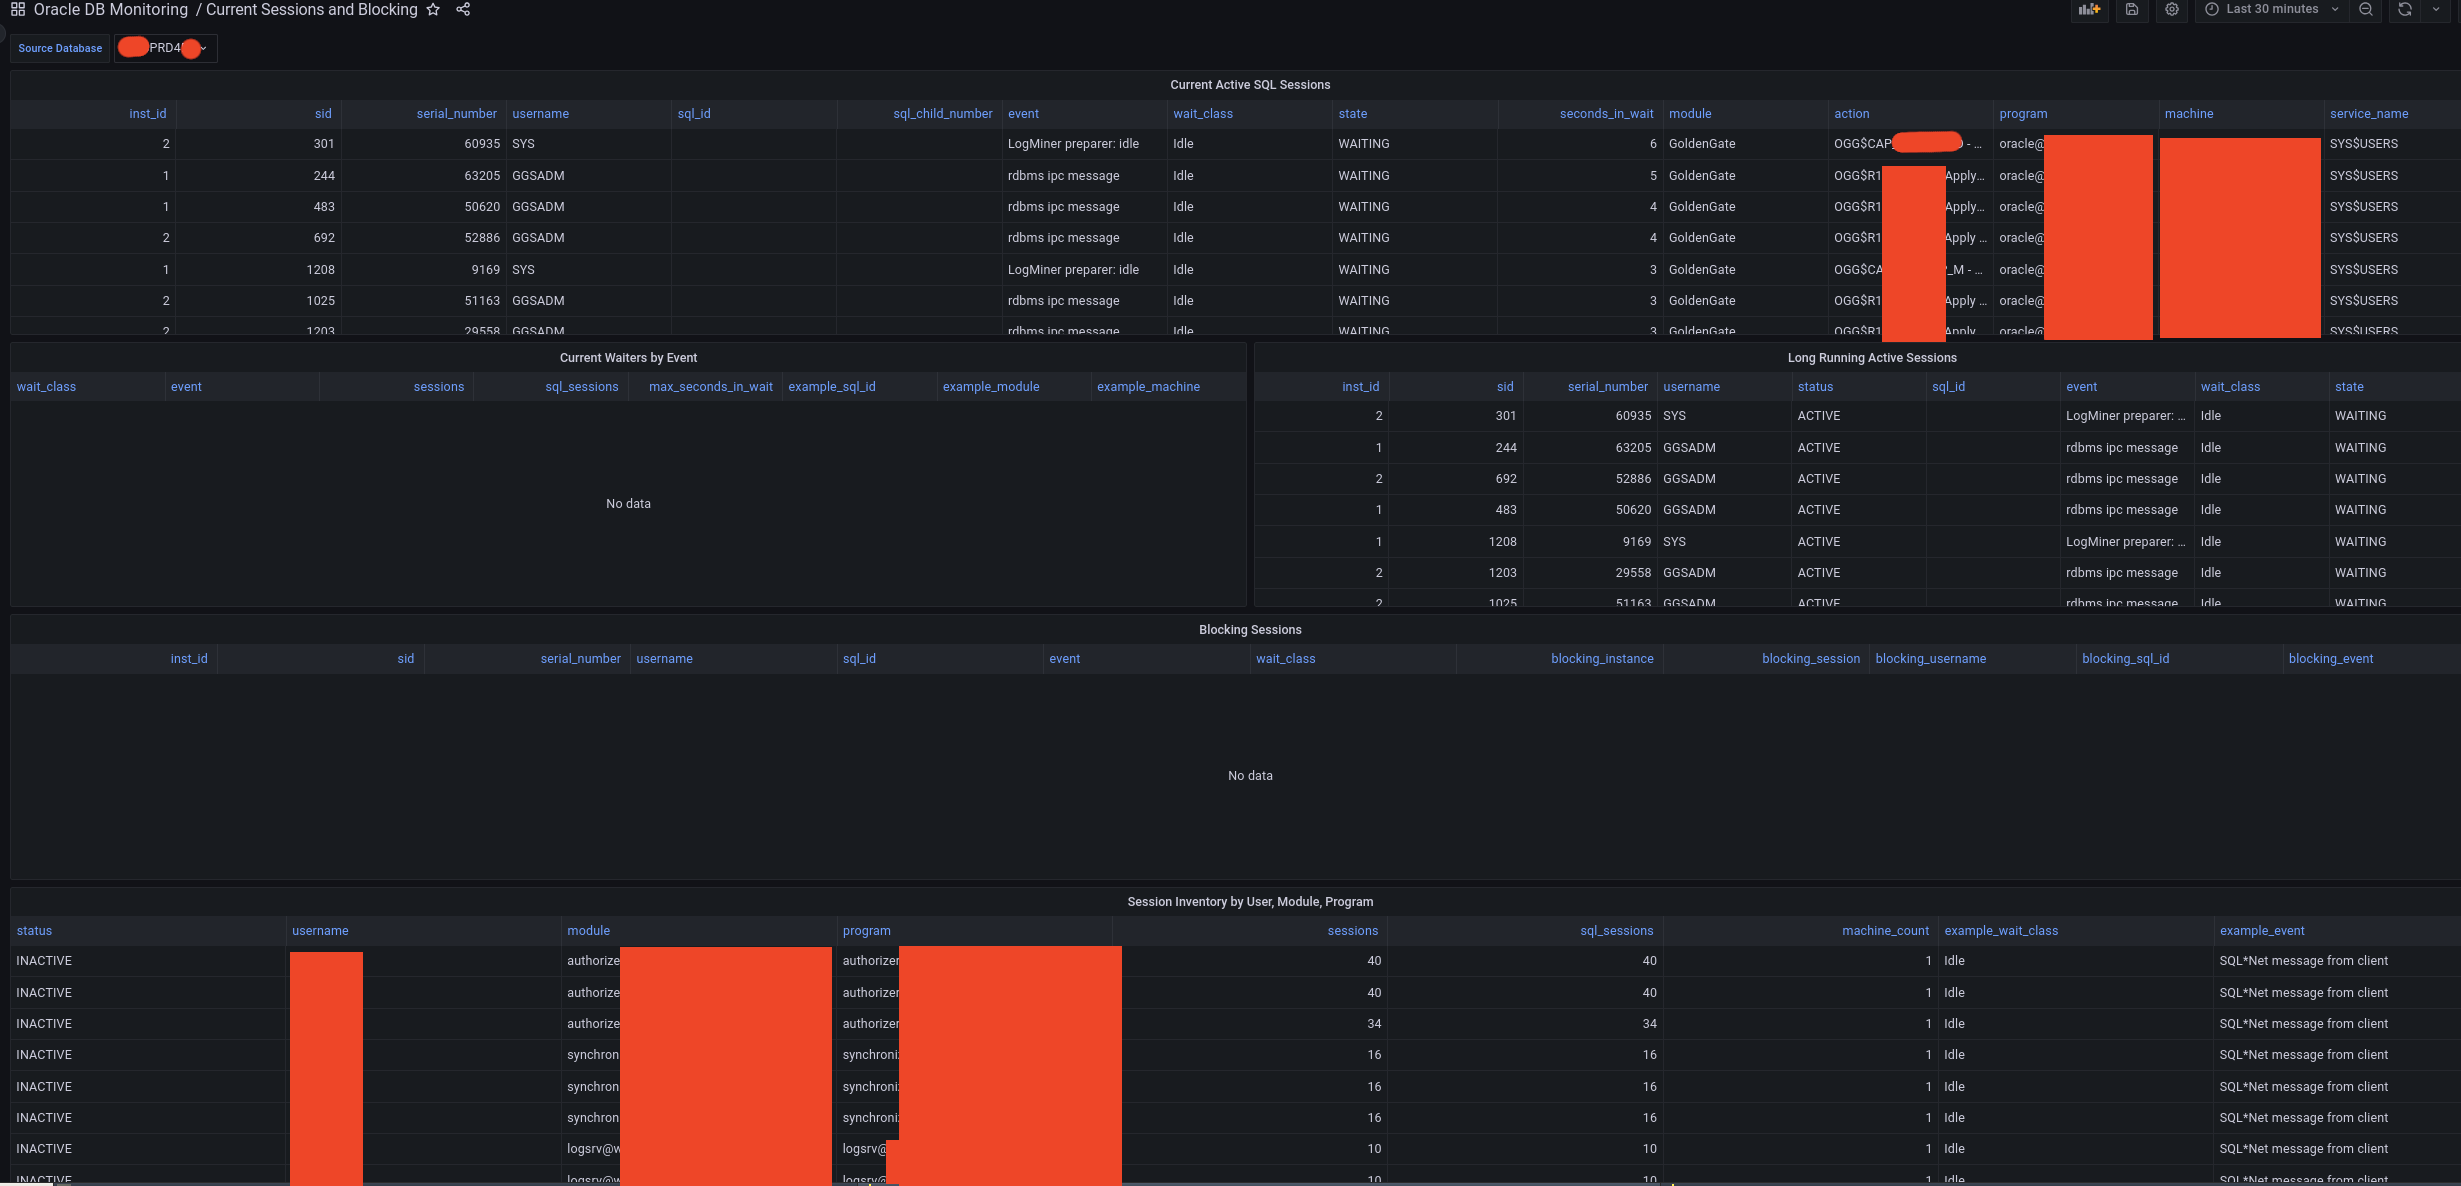
Current Sessions and Blocking dashboard with anonymized sample data. Select the image to open it at full resolution.
Harry PostgreSQL Repository Health
File:
docker-compose/grafana/dashboards/harry-postgresql-repository-health.json
Purpose:
- Total repository size, estimated Harry row count, retained partitions, and oldest retained partition.
- Partition-aware storage by Harry dataset and day.
- Exact daily ingest counts by source Oracle database and dataset, plus estimated physical storage attribution by source database.
- Ingestion continuity, change against a seven-day baseline, and projected 30-day repository storage.
- Current collector freshness, result counts, and collection errors.
- Scheduler lag, Oracle collection duration, PostgreSQL repository duration, total cycle pressure, missed intervals, and database completion counts.
- Per-database activity attempts, failures, timeouts, duration, sample volume, and latest error so an unhealthy database can be isolated from aggregate activity-cycle pressure.
- PostgreSQL cache efficiency, workload counters, table maintenance, dead rows, sessions, long-running queries, and lock waits.
- Current Grafana repository sessions and optional historical ranking of reads against Harry tables.
Harry records successful PostgreSQL writes in the partitioned
harry_repository_daily_ingest table. It keeps one row per UTC day and source
database, with separate counters for each native dataset. These counters make
the per-database and per-dataset row panels exact without scanning retained
sample partitions or depending on PostgreSQL planner statistics.
Accounting is buffered and normally flushed every five minutes. A graceful shutdown or HA leadership loss forces a final flush; an abrupt process or host failure can lose up to five minutes of accounting, but does not lose the sample rows already committed. Accounting begins after the version containing this feature is deployed and is not backfilled for older retained data.
The Scraper Runtime Pressure section reads harry_runtime_samples and
harry_latest_runtime_status. It separates Oracle collection time from the
PostgreSQL repository phase and compares total cycle duration with the actual
configured interval. These panels expose increasing Oracle, network, host, or
PostgreSQL pressure before collectors time out or data becomes stale. Harry
does not use the measurements to throttle collection. Runtime trend panels use
the Grafana dashboard time range and adapt their PostgreSQL aggregation bucket
to Grafana's calculated interval.
The Activity Collection Reliability by Database table uses the selected source databases and dashboard end time, but bounds history to the latest six hours. Activity status is recorded at the high-frequency activity interval, so this diagnostic bound prevents an accidental 30-day repository scan while retaining enough history to identify intermittent and persistent offenders.
sql_text_writes, sql_cursor_metadata_writes, and
sql_plan_operation_writes count successful write candidates against their
deduplicated dictionaries. They are not the number of currently distinct
dictionary rows or necessarily physical updates: unchanged cursor metadata is
not rewritten more than once per UTC day. Physical storage by source database
remains an estimate: Harry distributes each partition's measured heap and
index bytes according to its exact per-database row shares, but PostgreSQL
pages and indexes are shared within that partition.
When Grafana uses a role that was granted access before newer Harry objects existed, grant access after Harry creates them:
GRANT SELECT ON harry_repository_daily_ingest TO grafana;
GRANT SELECT ON harry_runtime_samples TO grafana;
GRANT SELECT ON harry_latest_runtime_status TO grafana;
GRANT SELECT ON oracle_sql_cursor_metadata TO grafana;
For future Harry tables, a database owner can instead configure suitable default privileges for the role that runs schema migration.
Historical query rankings require pg_stat_statements to be installed and
listed in shared_preload_libraries. The rest of the dashboard works without
the extension, and the Query History panel reports whether it is available.
pg_stat_statements does not retain application_name; use a dedicated Grafana
PostgreSQL role when historical Grafana-only attribution is required. Current
Grafana sessions are identified from pg_stat_activity.
PostgreSQL core statistics do not expose host CPU consumption. Use the platform's host-monitoring integration when CPU, memory, filesystem latency, or other operating-system measurements are required.
Hot-standby recovery conflicts
The Harry Collector Freshness and Results and Latest Samples by
Collector panels read oracle_latest_scrape_status. Harry continuously
upserts this small current-state table. On a PostgreSQL hot standby, WAL replay
of updates and cleanup from the primary can conflict with a standby query and
cancel it with:
ERROR: canceling statement due to conflict with recovery (SQLSTATE 40001)
This is normal PostgreSQL hot-standby conflict handling, not an invalid dashboard query. The two panels are therefore placed in the collapsed Latest Collector State section at the bottom of the dashboard. Grafana does not run their queries until the section is expanded.
Harry does not change PostgreSQL recovery settings automatically. The correct tradeoff is deployment-specific: preventing cleanup conflicts can increase dead-row retention and primary bloat, while allowing queries to delay recovery can increase standby replay lag. A monitoring product should not silently choose either behavior for the PostgreSQL cluster.
Inspect the affected standby before changing its configuration:
SELECT
    pg_is_in_recovery(),
    pg_last_xact_replay_timestamp(),
    now() - pg_last_xact_replay_timestamp() AS replay_delay;

SELECT *
FROM pg_stat_database_conflicts
WHERE datname = current_database();

SHOW hot_standby_feedback;
SHOW max_standby_streaming_delay;
SHOW max_standby_archive_delay;
SHOW log_recovery_conflict_waits;
Possible operator-controlled solutions are:
- Leave the section collapsed and expand it only when current collector detail is required.
- Connect Grafana to the writable PostgreSQL primary, or use a separate primary datasource for dashboards that require mutable current-state tables.
- Enable standby feedback in the standby's
postgresql.confto prevent vacuum cleanup conflicts. Monitor dead tuples and table bloat on the primary. - Increase the applicable standby delay in the standby's
postgresql.confso conflicting reads have longer to finish. Monitor replay lag and do not use an unlimited delay for an HA standby without accepting that consequence.
Example native PostgreSQL settings for a read-oriented standby are:
# On the standby only. Values are examples, not Harry requirements.
hot_standby_feedback = on
max_standby_streaming_delay = '60s'
max_standby_archive_delay = '60s'
log_recovery_conflict_waits = on
max_standby_streaming_delay applies to streaming WAL; the archive setting
applies while replaying archived WAL. Reload or restart PostgreSQL as required
by the setting and the local configuration-management system. See PostgreSQL's
hot-standby conflict handling
and replication settings.
Importing Manually
If you are not using the Compose provisioning files:
- Create a Grafana PostgreSQL datasource.
- Set its UID to
PostgreSQL, or edit the dashboard JSON files to match your datasource UID. - Import the JSON dashboards from
docker-compose/grafana/dashboards/.
Required Data
The dashboards assume the scraper is writing these tables:
oracle_database_activity_samplesoracle_sql_samplesoracle_sql_cursor_metadataoracle_sql_textsoracle_sql_plansoracle_session_samplesoracle_blocking_session_samplesoracle_database_status_samplesoracle_instance_samplesoracle_resource_limit_samplesoracle_tablespace_samplesoracle_asm_diskgroup_samplesoracle_system_counter_samplesoracle_wait_class_samplesoracle_scrape_statusoracle_latest_scrape_statusharry_repository_daily_ingestharry_runtime_samplesharry_latest_runtime_status
If a dashboard is empty, verify:
metrics.scrapeIntervalis configured.- PostgreSQL
output.postgresql.urlis correct. - the Oracle monitoring user can query the relevant
GV$views. - Grafana time range includes recently collected rows.
Grafana Alerting
The Docker Compose stack also provisions PostgreSQL-backed starter alert rules for collection freshness, Oracle connectivity, tablespaces, resource limits, ASM, and collection and runtime pressure. See Grafana Alerting for rule deployment, contact points, and the required independent monitoring of the scraper, PostgreSQL, and Grafana themselves.